Gathering Infrastructure and/or Performance Data for IBM Power (IBM i, AIX/VIOS, Linux)
Gathering infrastructure and/or performance data is an important step to shortening the time required to optimize the performance of IBM Power in Kyndryl Cloud Uplift on Azure or Kyndryl Cloud Uplift on IBM Cloud.
The only way to ensure the best performance experience for IBM Power in Kyndryl Cloud Uplift infrastructure is to have a complete understanding of your current hardware configuration(s) and performance data. This includes the IBM Power model, IBM PowerVM settings, disk models and configuration, memory allocation(s) and performance metrics for all the above.
The following section outlines options for accessing and gathering the infrastructure and/or performance data, including the pros and cons of each option. At a minimum, infrastructure data is required to help configure each VM close to the current configuration.
This guide is provided “as-is”. Information and views expressed in this document, including URL and other Internet website references, may change without notice. You bear the risk of using it.
This document does not provide you with any legal rights to any intellectual property in any product. You may copy and use this document for your internal, reference purposes.
Table of Contents
- Tooling for Power Discovery (Infrastructure)
- Native Power Discovery for IBM i
- Native Power Discovery for AIX via VIOS
- Power Discovery for Linux
Tooling for Power Discovery (Infrastructure)
HMC Scanner for POWER Servers
Pros:
- Contains the hardware infrastructure configuration for all systems connected to the HMC.
- Supports multiple OS’s – Windows, Linux, AIX, IBM i.
Cons:
- Memory – only allocation data, no performance data.
-
Disk – only allocation data, no performance data.
Notes:
- Data collection needs to be explicitly enabled on the HMC since it is not active by default. The easiest way to enable it is to log into the HMC with administrative rights on the command line and issue the following command: chlparutil -r config -s 300. This will enable data collection for all current managed systems on the HMC, but not on future ones. Just wait for a couple of days and the scanner will provide performance data.
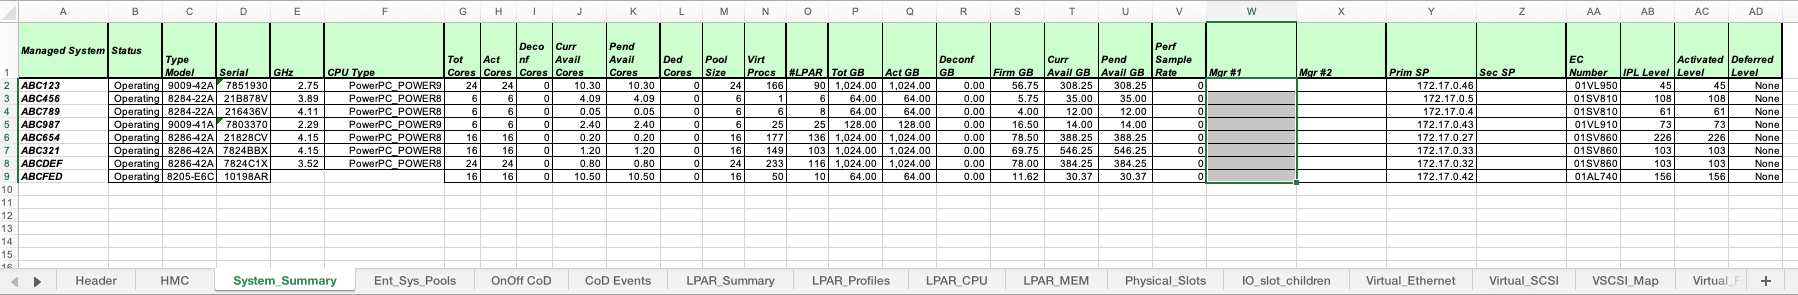
- You can check if data collection is active by looking at the scanner's report. Select the System Summary tab and look at the Perf Sample Rate column: if the cell is empty or has a zero value, data collection is not active.
Output: Excel spreadsheet
Requirements:
-
HMC Scanner runs on the Java Runtime Environment (Version 8) can be downloaded from the link below.
- Requires network access from the Windows PC to the HMC.
- This requires access to the HMC, hscroot ID and PW.
Use the HMC Scanner to quickly extract all the details of the POWER Servers the HMC is connected to and saved in a Microsoft Excel spreadsheet.
The tool is available at the end of this document as a zip file that needs to be extracted on an empty directory. Latest version is "hmcScanner-0.11.42.zip".
HMC Scanner is a Java program that uses SSH to connect to an HMC,SDMC,FSM or IVM (IVM is experimental), downloads the system configuration and produces a single Excel spreadsheet that contains the configuration of servers and LPARs. In PureFlex environments, only Power Systems compute nodes are detected. Optional HTML and CSV outputs are available.
The result is a straightforward way to document configuration and to easily look at the most important configuration parameters.
Excel information is organized in tabs:
- System Summary: name, serial number, cores, memory, service processor IP for each server.
- LPAR Summary: list of all LPARs by server with status, environment, version, processor mode.
- LPAR CPU: processor configuration of each LPAR.
- LPAR MEM: memory configuration of each LPAR.
- Physical Slots: list of all slots of each system with LPAR assignment, description, physical location and drc_index.
- Virtual Ethernet: network configuration of each virtual switch and LPAR.
- Virtual SCSI: configuration of all virtual SCSI adapters, both client and server.
- VSCSI Map: devices mapped by each VIOS to partitions.
- Virtual Fibre: virtual fibre channel configuration of client and server with identification of physical adapter assigned.
- SEA: SEA configuration and statistics for all VIOS.
- SW Cores: LPAR and virtual processor pool configuration matrix to compute the number of software licenses. Simulation of alternative scenarios is possible.
With optional flags it is possible to download historical CPU usage data from HMC and add it in the report. HMC performance data collection needs to be enabled on the HMC before running the scanner or the report will only have empty fields. Data collection is off by default on the HMC. The following tabs are related to managed system performance:
- CPU Pool Usage: monthly average history of CPU usage of each system.
- Sys RAM Usage: monthly average history of physical memory assignment to each LPAR.
- LPAR CPU Usage: monthly average history of CPU usage of each LPAR.
- CPU Pool Daily Usage: 1 year of CPU usage of every pool and sub-pools of each system. Based on daily averages.
- LPAR Daily Usage: 1 year of CPU usage of every LPAR of each system. Based on daily averages.
- CPU Pool Hourly Usage: 2 months of CPU usage of every pool and sub-pools of each system. Based on hourly averages.
- LPAR Hourly Usage: 2 months of CPU usage of every LPAR of each system. Based on hourly averages.
The tool is constantly updated to match changes in tool syntax, to manage new data types and add new features. If you have any problems or suggestions to improve HMC Scanner, please send Federico Vagnini at IBM Italy an email (vagnini@it.ibm.com). Since new features are mostly suggested by users, propose yours. Please always include the downloaded files to allow for proper debugging.
This tool is not officially supported by IBM. No guarantee is given or implied, and you cannot obtain help from IBM. It is a personal project of the author, Federico Vagnini (IBM Italy).
See also pGraph page form the same author. It allows multiple nmon, vmstat, iostat, sar, lslparutil files to be loaded regardless of their size. Graphs are provided together with a very useful "time zoom" that allows you to select the time period to show.
https://www.ibm.com/support/pages/hmc-scanner-power-server-config-and-performance-stats
Running HMC Scanner on Windows PC
HMC scanner must be used on a system with Java 1.6 or later available that is capable of contacting HMC with a direct SSH connection or using an SSH connection through a HTTP, SOCKS4 or SOCKS5 proxy server. The HMC must allow remote SSH command execution.
Please follow these steps:
- Download the latest available code since it contains the latest fixes and capabilities. You can find it at the end of this document as a zip file.
- Unzip the code into a new empty directory.
- Inspect the hmcScanner.ksh and hmscScanner.bat files to check if they are able to locate Java executable on your system.
- If you want to collect performance data, make sure data collection was enabled (activation instructions are above).
-
Run the scanner by providing HMC address, user and password.
Example of Windows command:
C:\\user\\rwatson\\downloads\\hmcscanner.bat \<HMC IP> -p xxxxxx -stats sanitize -p=IP address, -stats=collect stats, -sanitize=removeIPaddressesAn example of the spreadsheet is below. Note the tab at the bottom which shows all of the frames (serial numbers) connected to this HMC. The LPAR and configurations can be found in the other tabs.
- Send the resulting spreadsheet to Kyndryl Cloud Uplift for analysis.
Note If you do not provide a password on the command line, the scanner will use on Unix the public key located in $HOME/.ssh/id_rsa or the one provided with the -key parameter (the key must not have a password). If no key is available, the scanner will ask for the password interactively (not suited for batch processing)
Native Power Discovery for IBM i
IBM i operating systems automatically collect hardware and performance data via Collection Services. This data has more detailed data regarding hardware resource consumption and memory and disk configuration/performance. There are 3 options to package this data and send it to Kyndryl Cloud Uplift for analysis.
Option 1: Manually create a save file of *MGTCOL
Option 2: Use Must Gather Tools to create the save file
Option 3: Use Performance Navigator to collect historical data
Option 01: Save file of *MGTCOL object
Pros:
- Contains 1-5 days of Collection Service data which has ALL infrastructure and performance data for each partition.
Cons:
- Large file(s) = 1-50GB from each partition.
- An analyst must upload to an IBM i partition, restore, and use performance tools, as well as Navigator for IBM i or other third-party products to analyze.
Output: IBM i save file from each partition
Examples of IBM i commands from each partition:
> crtsavf qgpl/pfrcustnam
> savobj obj(\*mgtcol) lib(qpfrdata) dev(\*savf)
> savf(qgpl/pfrcustnam) dtacpr(\*yes)
Then send the save file pfrcustnam to Kyndryl Cloud Uplift.
A Kyndryl Cloud Uplift Cloud Solutions Architect or Cloud Solutions Engineer will then do the following on an IBM i VM for your data:
> crtsavf qgpl/pfrcustnam
> SFTP PFRCUSTNAM to pfrcustnam (save file on IBM i VM)
> crtlib pfrcustnam
> ***RSTOBJ OBJ(\*ALL)
> ***SAVLIB(QPFRDATA)
> DEV(\*SAVF)
> SAVF(QGPL/PFRCUSTNAM)
> RSTLIB(PFRCUSTNAM)
> Crtpfrcol frommgtcol(pfrcustnam/Qxxxhhmmss) tolib(pfrcustnam)
Note Qxxxhhmmss is the member name of the *MGTCOL object
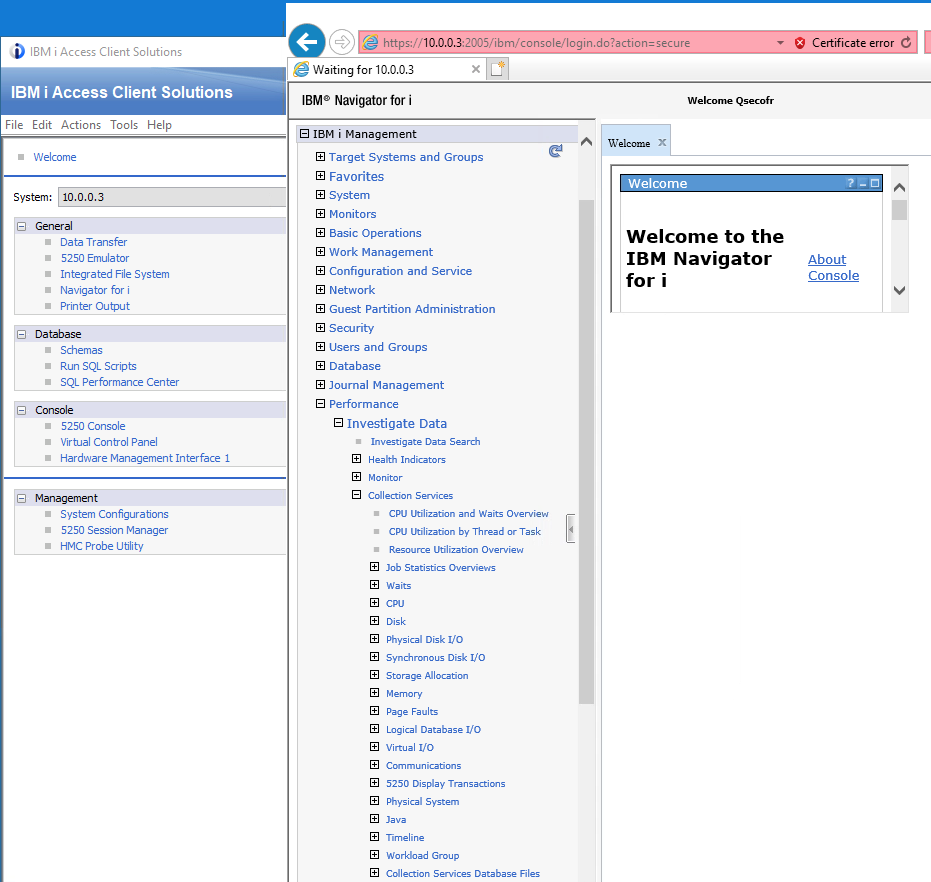
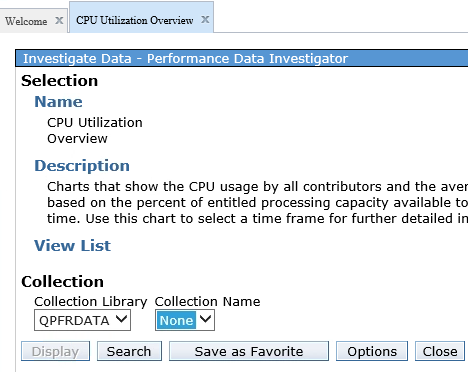
If you are using Navigator for i to look at the data, then start the ACS. Navigate to Navigator for i > Investigate Data > Collection Services, and then select a metric.
-
Select a metric and then select your performance data library PFRCUSTNAM from the pull-down field, select the Collection name if multiple and display.
-
If using Performance Navigator prompt (F4) the following command on the IBM i command line:
mpglib/mpgdr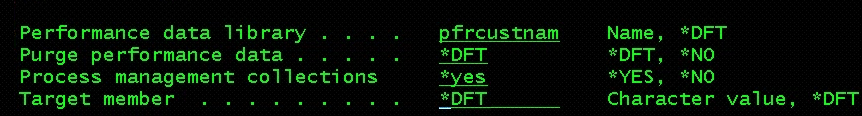
Note Change the Performance data library to your performance data library and Process management collection to *yes and press Enter.
-
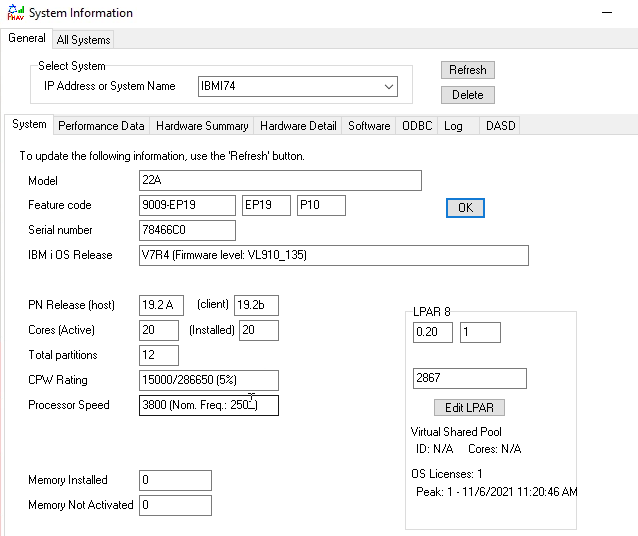
Start Performance Navigator, make sure you are connected to your IBM i VM and navigate to View System Info > Performance Data tab and click the down arrow to select the new data.
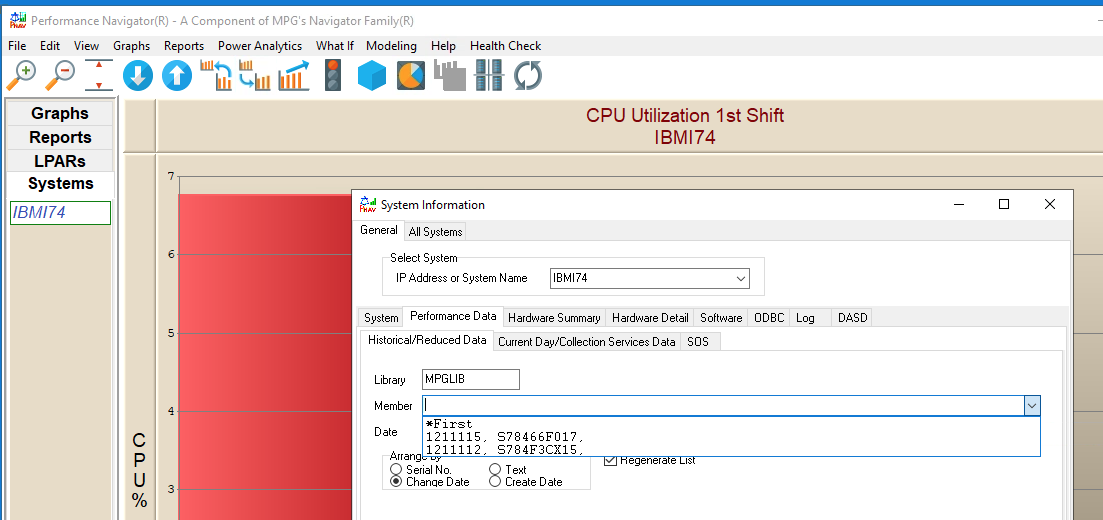
Your system(s) name will show up in the navigator panel on the left. You can see your hardware configuration via the View > System Information options.
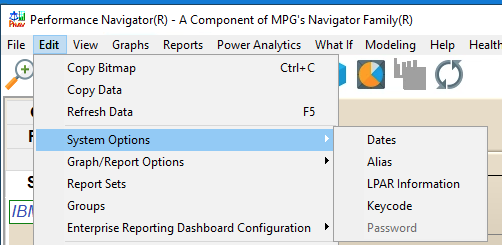
Note The Performance Navigator client track connection with system names. If you are connecting to a second system with the same name you have to create an alias. Navigate to Edit > System options, click the HA tab, and then select System 1. Close and restart Performance Navigator. You should now see the system name with an ‘_1’ at the end.
There are three free graphs available without a keycode:
- Graphs/CPU/by priority
- Graphs/Disk/space utilization
- Health Check
To have full access to all the data you need to enter a keycode. Once you receive the temporary keycode, navigate to Edit > System Options > Keycode and enter the key. Close and reopen the program to have full access.
Option 02: Using Must Gather Tools
Pros: Follow instructions below on each partition. Option ‘b’ disk data is a small output ~2-10MB.
Cons: 70+ text file. Must be V7R2 and above. Snapshot of current configuration ~xxGB.
Output: Zip file called – <system name>_SYSSNAP_202108271403.zip or /tmp/diskmetrics_<sysnam>.zip for disk only data.
-
If you are at V7R2 IBM i or later do the following:
- Navigate to the Must Gather Tools menu – GO QMGTOOLS/MG
- First check for any updates, option 13
-
Select option 3 – Performance/Mics collection
- Select option 3 – Collection Services
-
Select option 2 – Copy Performance Data
This option will create a save file of one or more Collection Services data. The save file will be 'xx' GB in size. This will give us the infrastructure and performance data from that one day.
- Set option Save file to "Y" and hit enter
- Select the first QxxxHHMMSS member not in use and hit enter
- Send Kyndryl Cloud Uplift the save file that is created in the IFS in directory /tmp/IBMCSDATA/IBMDATA002
-
If all Kyndryl Cloud Uplift needs access to is the disk metrics then do the following:
- Go to the Must Gather Tools menu – GO QMGTOOLS/MG
- Select option 3 – Collection Services
- Select option 15 – Collect disk metrics from CS
-
Next screen hit enter
This will create a zip file in /tmp/diskmetrics_<sysnam>.zip
- Send Kyndryl Cloud Uplift the diskmetrics zip file
Note There will be 70+ .csv or txt files available.
Option 03: Performance Navigator from Help Systems
Pros: Automates the historical collection of infrastructure and performance data – Small file to send ~1-10MB. Exclusive What-If function to model workload to different systems. Can track every job and user resource consumption history. Helps to address performance questions. Free access to infrastructure data and high-level CPU utilization and disk space (both installed and used).
Cons: Access to full options requires license.
Collecting historical data with no overhead and little disk space:
-
Download a Windows Client and IBM i host code using the following links:
- Click on perfnav.exe to install the Windows component. This is a self-extracting install program that just puts an ICON on the desktop.
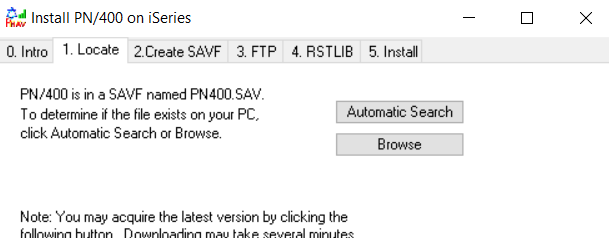
- The first time you launch perfnav, it will prompt you to install the IBM i host code pn400.sav. Reply YES. A PN400 install window will appear.
-
In tab 1.local, browse to the pn400.sav file you downloaded. Then follow tab 2-5 on each partition.
-
Following a minimum period of 24 hours, start Perfnav and reply NO to the PN400.sav install. In the System Information window, enter the system name or IP address of the first LPAR and click NEW.
Note This will create a connection to the partitions using ACS ODBC driver.
- Connect to all the other LPARs via the File > New IBM i, enter system name or IP address and click NEW.
-
Once connected to all LPARs, go to File/SOS, highlight the first system name and shift + click the last system name. Then click Save to Disk. This will create one file for each partition called sos_serial#xx.GpD. Note the directory in the log.
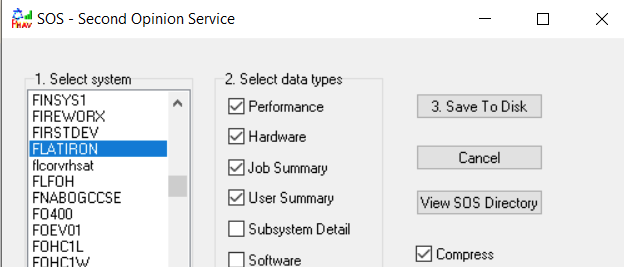
- Then email Kyndryl Cloud Uplift the SOS files. They are usually very small (1-3MB).
-
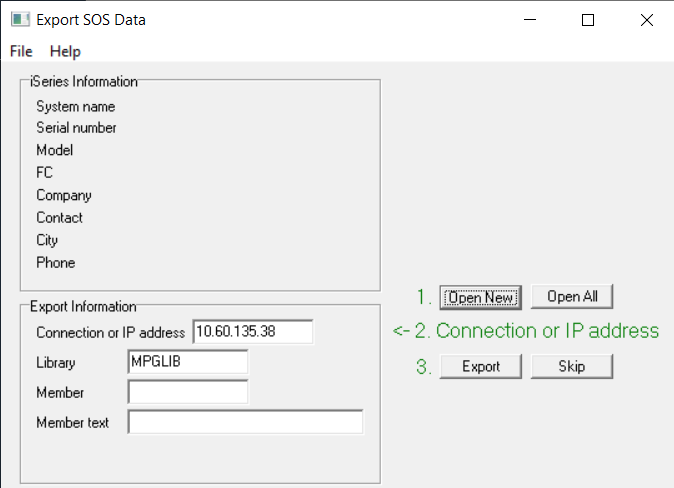
Upload SOS file to IBM i VM:
- Upload the SOS data using the Windows program SOS3
- Open the SOS file with Open All
- Enter IP address of the IBM i VM to store data
-
Click Export
This will add a member to the Performance Navigator file on the IBM i VM.
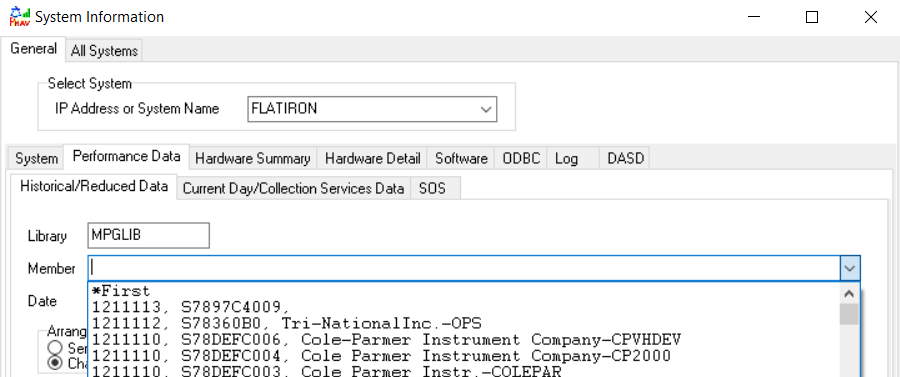
-
To connect the Performance Navigator client to the data, navigate to View > System Info for the IBM i VM, click the Performance Data tab, then the down arrow by the member's name and select the member.
Native Power Discovery for AIX via VIOS
AIX and VIOS automatically collect hardware and performance data via Topas. One simple script can consolidate the data and create one file to be sent to the analysis. There are 3 options to collect hardware and performance data.
Options 1: Collect the 7 days of Topas data
Option 2: Use existing nmon data
Option 3: Install Performance Navigator to collect historical nmon data
Option 01: Collecting Topas data
- Obtain the rackdata.tar.gz file from Kyndryl Cloud Uplift or, using WinScp or FileZilla, download rackdata.tar.gz from ftp.mpginc.com
- SFTP or FTP to /tmp on each LPAR
- Unzip and untar - cd /tmp;gunzip -f rackdata.tar.gz;tar -xvf rackdata.tar;./rackdata.sh -T
- Send file in /tmp called pninfo_topas_hostname_2021mmdd_mmss.tar.gz from each LPAR
Pros: By default AIX keeps 7 days of historical Topas data. Contains infrastructure and performance data. Includes free graphic view of all data using Google graphs.
Cons: Only 7 days of performance data, can only look at 1 day at a time.
Output: 1 file per partition called pninfo_topas_<hostname>_date_time.tar.gz

File should be between 5-10MB.
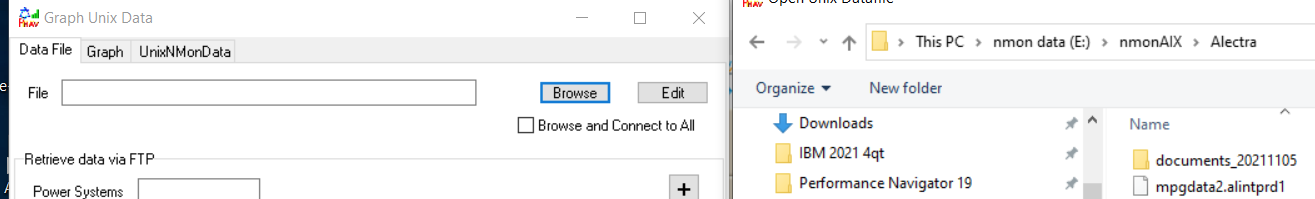
To connect your data to the Performance Navigator client
- Unzip, untar the pninfo file.
-
From Performance Navigator, navigate to File > New AIX > Linux menu and browse to the directory for your data. Select the mpgdata2.hostname file and open.
To view the Topas data via Google Chart
-
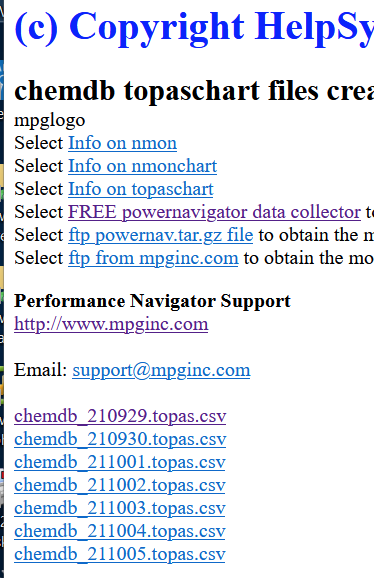
Click on the LPARname_HSdata_topas folder for any given LPAR then click the mpg_hostname_tchart_rackdata.html
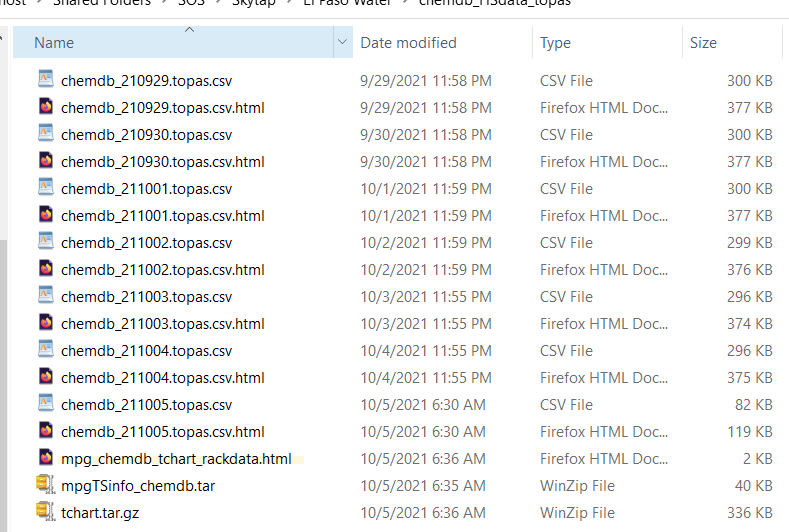
-
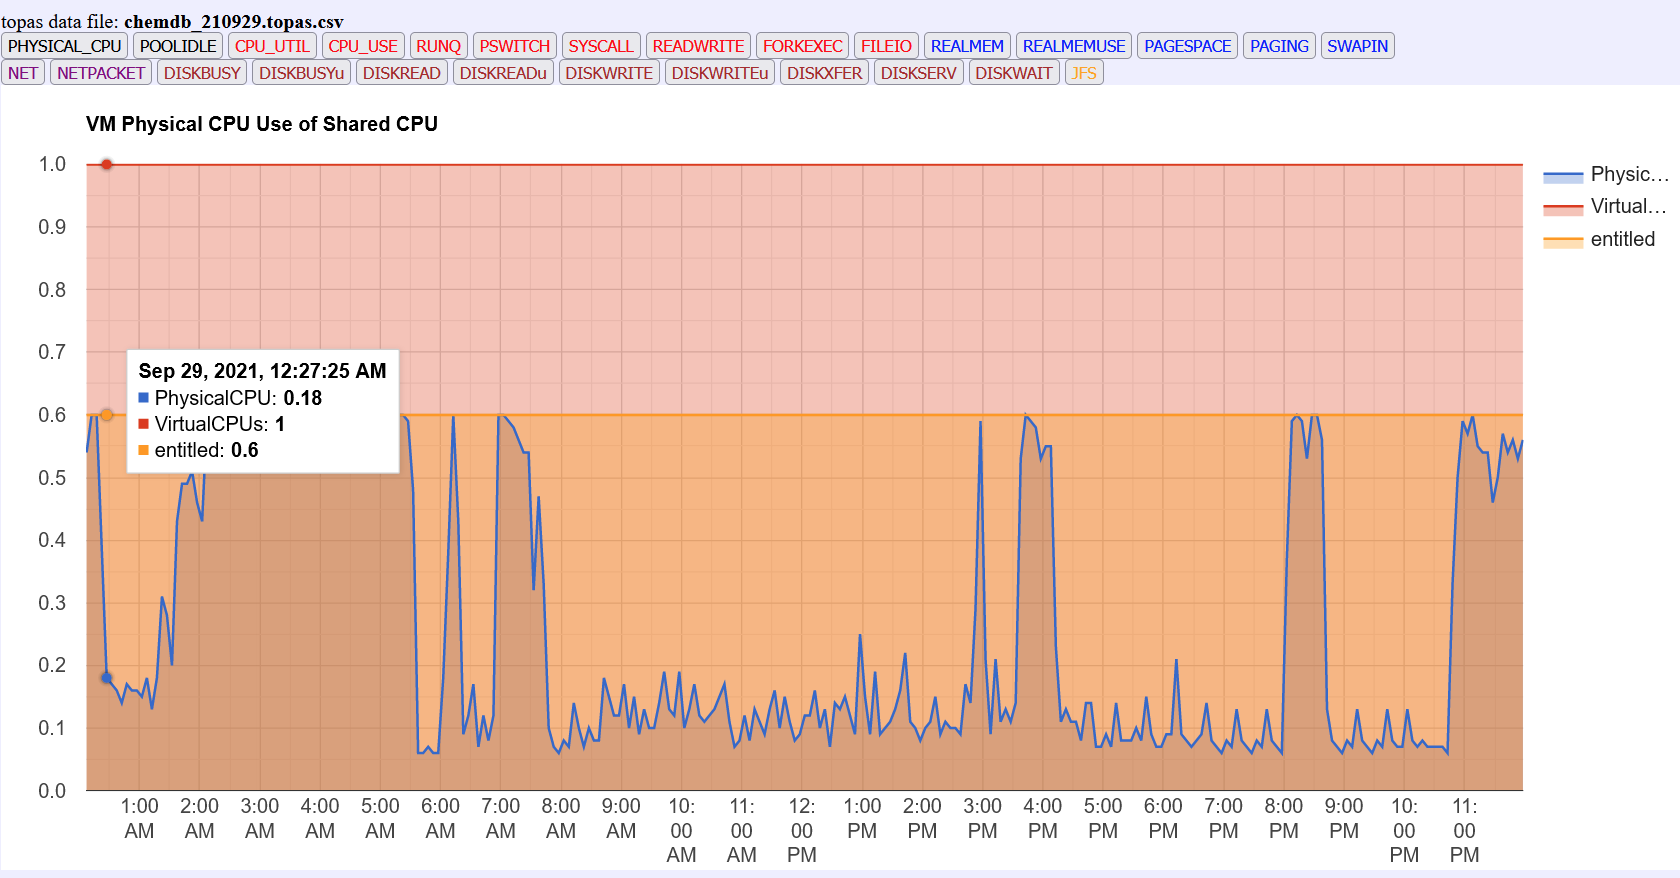
Click on one of the hostname_date_topas_cvs to see the one day with Google Chart
It will launch the browser to view the data for the one day with Google Chart. Just click on any of the tabs at the top. The example below is the Physical CPU graph:
Option 02: Collecting existing nmon data
- Obtain your pnbuild.tar.gz file from Kyndryl Cloud Uplift or, using WinScp or FileZilla, download pnbuild.tar.gz from ftp.mpginc.com
- SFTP or FTP to the same directory where existing nmon exists.
- Unzip and untar - cd /tmp;gunzip -f pnbuild.tar.gz:tar -xvf pnbuild.tar; ./pnbmpgd2gzip.sh
- Send file called pninfo_multiple_AIX.tar.gz to Kyndryl Cloud Uplift
Pros: If you already have existing nmon data, Kyndryl Cloud Uplift can use this data. Nmon data has more info than Topas. Usually more than seven days. If you normally consolidate nmon data to a single shared directory, one script will gather data from all partitions for free.
Cons: File could be large depending on the amount of history (~10-25GB). No graphical view.
Output: 1 file containing all partition in shared directory called pninfo_multiple_AIX.tar.gz.
Option 03: Start collecting historical nmon data
Pros: Starts the management of the historical collection of nmon. Includes graphic view of last 7 day with Google graphs for free.
Cons: Will have to wait one week or two to receive data.
Output: 1 file per partition called pninfo_<hostname>.AIX.tar.gz
-
Download powernav.tar.gz from the link below: [https://hsdownloads.helpsystems.com/software/robot/performance-nav/powernav.tar.gz]{.ul}
- SFTP or FTP to /tmp on each partition
- Unzip and untar - cd /tmp;gunzip -f powernav.tar.gz;tar -xvf powernav.tar; ./install.sh
- Wait a week or two to collect a month end
- Send file in /usr/local/mpg called pninfo_<hostname>_AIX.tar.gz to Kyndryl Cloud Uplift
To connect the data to the Performance Navigator client see above.
Power Discovery for Linux
Note Linux operating systems do NOT collect hardware and performance data by default. Kyndryl Cloud Uplift uses the HelpSystems Performance Navigator to automate the collection of hardware and performance for Linux across all platforms using open source nmon for Linux. This data will show how your current hardware is configured and how it is being used. This data will be used to then optimize the configuration in the Kyndryl Cloud Uplift environment.
Option 01: collect historical nmon data
Pros: Starts the management of the historical collection of nmon. Includes graphic view of the last 7 days with Google graphs for free.
Cons: Will have to wait a week or two to receive data.
Output: 1 file per partition called pninfo_<hostname>.Linux.tar.gz.
-
Download powernav.tar.gz from the link below: [https://hsdownloads.helpsystems.com/software/robot/performance-nav/powernav.tar.gz]{.ul}
- SFTP or FTP to /tmp on each partition
- Unzip and untar - cd /tmp;gunzip -f powernav.tar.gz;tar -xvf powernav.tar; ./install.sh
- Send file in /usr/local/mpg called pninfo_<hostname>_Linux.tar.gz to Kyndryl Cloud Uplift
Note To connect your data to the Performance Navigator client see above.